Graph-of-Models - a journey of a thousand miles begins with a single step
Hohoho, finally, I did something instead of talking ![]()
There are 2 main achievements I will present in this post. First, I calculated the Cosine Similarity (Gunawan et al., 2018; Dehak et al., 2010). Second, I have attempted to fine-tuned first miniModel_1, even though the result isn’t so good, but still.
I can show Jupyter Notebook and such in this blog, but I won’t do that here, at least today. I believe the engineering mindset is more worth sharing and the code is already in GitHub repo.
GitHub repository (just in case): vtrnnhlinh/Graph-of-Models
What I did?
I will try to explain from the idea, purpose to implement.
Repo Structure
The current code structure of this project is something like this:
.
├── datasets
│   ├── dataset_1
│   ├── dataset_2
│   ├── dataset_3
├── edges_calculation
│   ├── cosine_similarity
│   │   └── results
│   └── jaccard_index
├── environment.yml
├── graph-of-models
├── graph_visualization
│   ├── cosine_similarity
│   └── jaccard_index
├── inference
├── LICENSE
├── Models
└── README.md
The workflow is divided into different components (folders). The output of previous component will be saved to suitable formats like .parquet or .csv. This will help saving time and easier debugging.
The newest structure you can visit the GitHub repo.
The datasets and Models contents are in .gitignore due to its mass size. Read README.md of each folder to setup yourself if you want to re-enact my work.
Preprocessing Data
I use .parquet as the default dataset filetype to process in this project. Why? Because it’s effective for large dataset, which is necessary for fine-tuned our models (Ivanov & Pergolesi, 2020).
That means you need a code file to do the conversion. It’s not so hard to implement. With my current need, I only need to convert from .csv to .parquet.
To calculate Cosine Similarity and Jaccard Index, we need to have a core column sharing the same name. Our datasets are all in food-related topic, so I choose ingredients as the core.
That makes us have to manually pre-process the data by convert the suitable column in each dataset to ingredients. The detail code I used is in edges_calculation/general_preprocess.ipynb file.
Cosine Similarity Preprocessing and Calculation
To calculate the Cosine Similarity, we need to vectorize the datasets.
That makes us need to combine all subdatasets of each miniModel’s dataset into one big .parquet file: dataset_N_cos.parquet.
Then we will clean the dataset and vectorize it, compute the average Cosine Similarity, export to .csv file and voila~.
Cosine Similarity Graph Visualization
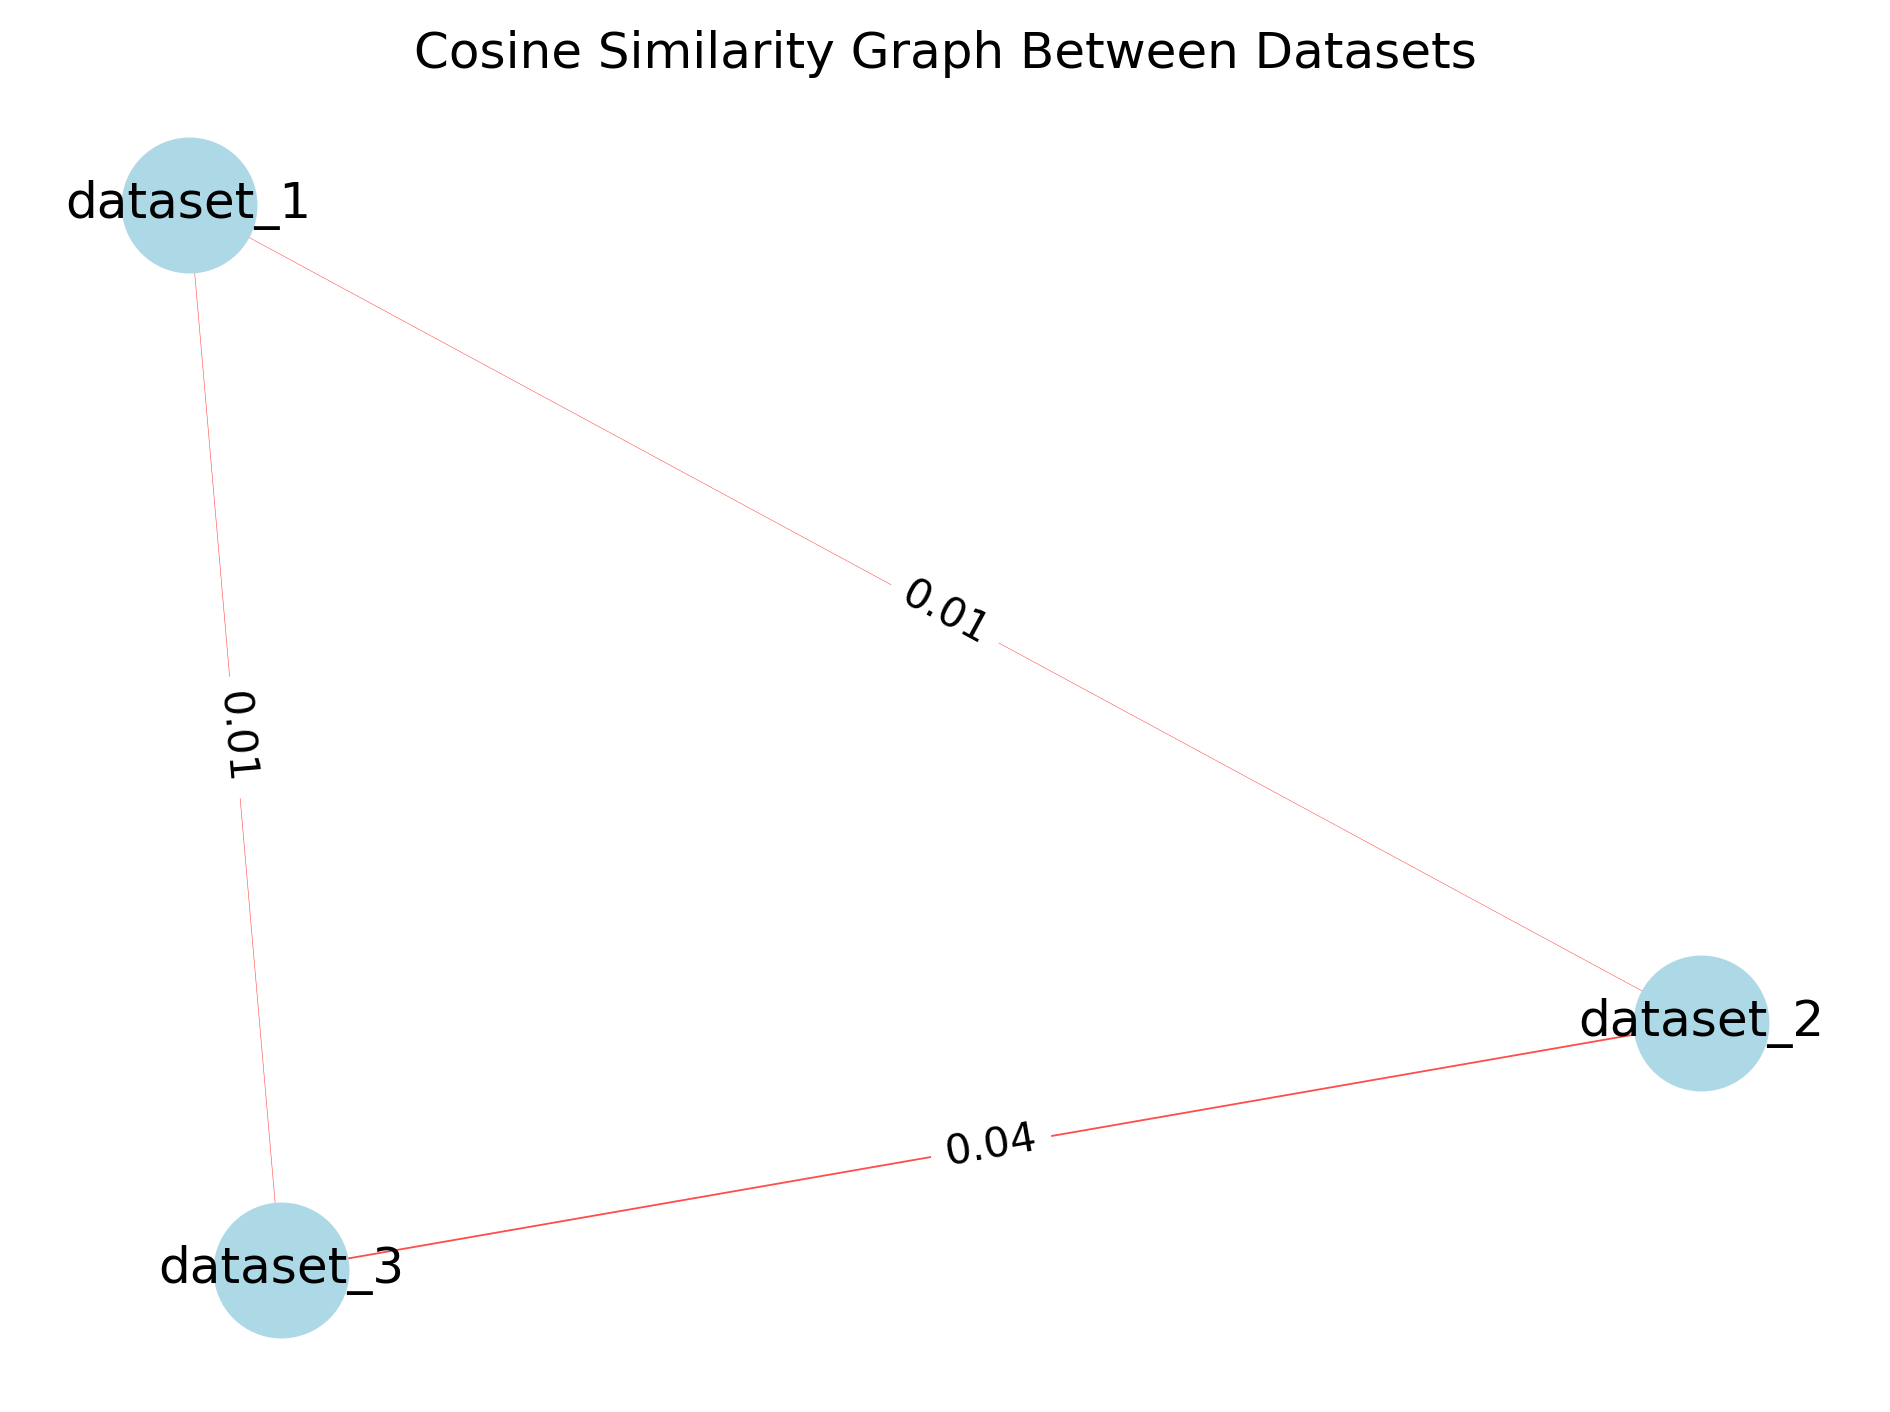
We will have a seperate module to visualize the graph. Importing the .csv file from Cosine Similarity Calculation with the edges are the average cosine similarity value, nodes are the datasets.

The first Cosine Similarity result we have.
Fine-tune miniModel_1
To avoid environment conflicts, we will create a seperate conda environment to fine-tune this model.
I use LoRA to train Qwen3-0.6B model for miniModel_1. The dataset and the model is small, but it still seems too much with my laptop.
The result is the fine-tuned model seems dumb. After revision, I see I only take a column in my dataset to train, which is lacking a lot of datas.
Some reflections
- The Cosine Similarity result seems suspicious. I actually expect the
dataset_1will be the center!!! - My NVIDIA GTX 4060 isn’t enough to train AI, I should better use company’s server :>
Future action
- I need to generalize the code to let graphing in large number, not only 3 models.
- Calculate and visualize Jaccard Index graph.
-
dataset_2seems more legit, I think I will fine-tuneminiModel_2first.
References
- The implementation of cosine similarity to calculate text relevance between two documentsIn Journal of physics: conference series, 2018
- Cosine similarity scoring without score normalization techniques.In Odyssey, 2010
- The impact of columnar file formats on SQL-on-hadoop engine performance: A study on ORC and ParquetConcurrency and Computation: Practice and Experience, 2020
Enjoy Reading This Article?
Here are some more articles you might like to read next: